Building a standard local development environment
Hi! Petr Korobeinikov here again, tech lead for the Redis and RabbitMQ services at #CloudMTS. Today we’ll talk about the single most important component of Developer Experience (DX) – the developer’s local environment. Or rather, about how to make it spin up fast and automatically, and also keep it uniform across every member of the team.
I’ll share our approaches and point out a few things that may be specific to developing cloud services. In this article I won’t get into implementation details – everyone’s implementation can be different. But I think the approach itself will be useful to many.
Why a standard local environment matters for a developer barely needs explaining. Just recall your own technical onboarding. More often than not, instead of a real onboarding you get handed a pile of half-finished Confluence articles that you can barely make sense of.
Meanwhile you still need to set up your new workstation, find out which tools you’ll need, where the repositories you need for work live, and what workflow is used for getting tasks done.
A unified local environment that deploys automatically, by the same rules for everyone, makes onboarding easier for a newcomer. And it brings a couple more bonuses:
- Server software versions will match between the local environment and production, down to the patch level.
- Every tool you need shares a common, uniform interface that hides the underlying complexity of actually using it.
The local environment in a single console utility
We packaged the interface to the standard local developer environment into a console utility and named it dxctl – developer experience control.
It’s written in Go to make distributing the executable itself easier.
But you can implement an equivalent in whatever language is used at your company.
Here’s what it can do:
dxctl sandbox up– brings up the entire server-side stack a developer needs on their machine to develop services locally;dxctl sandbox down– shuts the local environment down;dxctl sandbox status– shows whether the local environment is currently running, and exactly what’s running;- calling
dxctlwith no arguments prints a dashboard of the locally available services to the console – here’s an example:
+------------+---------------------------------------------------------------+
| SERVICE    | ADDRESS                                                       |
+------------+---------------------------------------------------------------+
| Dashboard  | http://localhost                                              |
+------------+---------------------------------------------------------------+
| Postgres   | N/A, connect only via PgBouncer                               |
|            | http://localhost/pgweb                                        |
| PgBouncer  | localhost:6432                                                |
+------------+---------------------------------------------------------------+
| Kafka      | localhost:9092                                                |
| Kafdrop    | http://localhost/kafdrop/                                     |
+------------+---------------------------------------------------------------+
| Grafana    | http://localhost/grafana                                      |
| Prometheus | http://localhost/prometheus                                   |
| Jaeger     | http://localhost/jaeger                                       |
|            | JAEGER_AGENT_ENDPOINT="localhost:6831"                        |
|            | JAEGER_COLLECTOR_ENDPOINT="http://localhost:14268/api/traces" |
+------------+---------------------------------------------------------------+
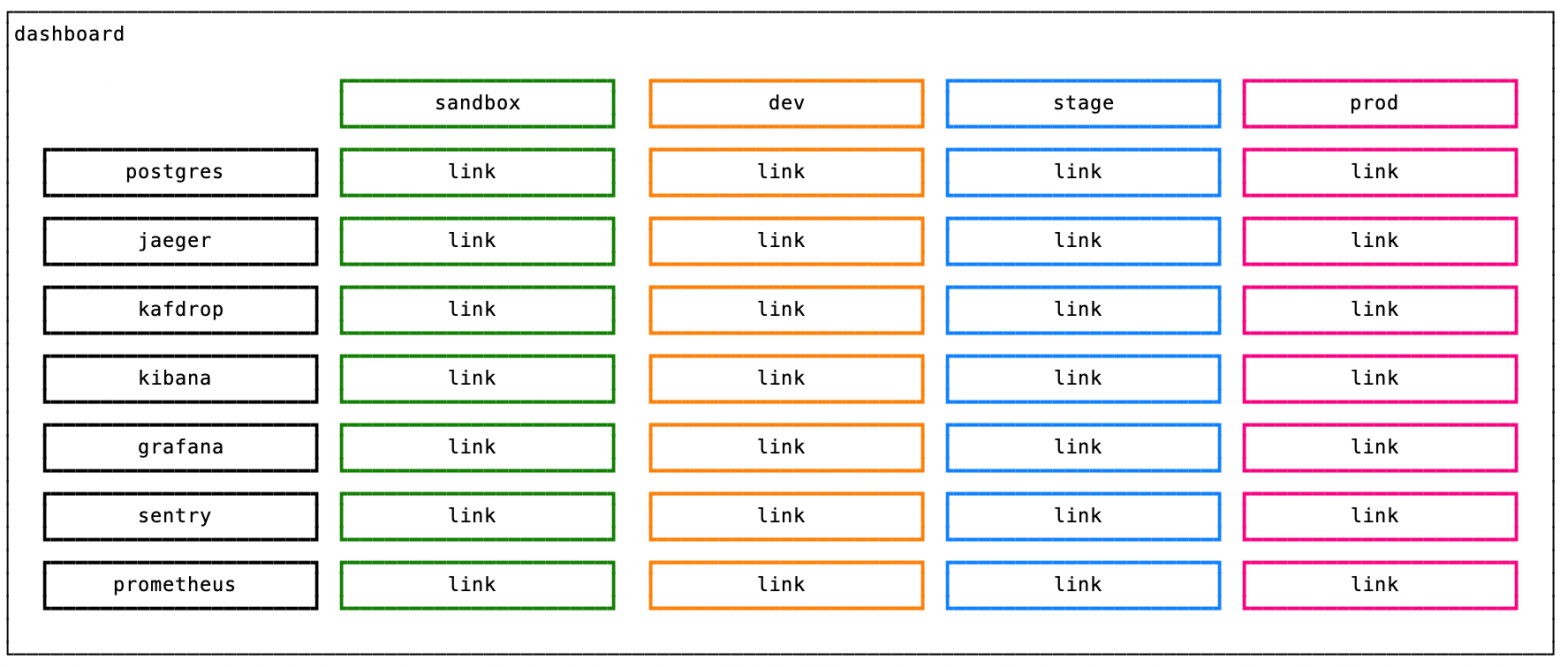
Besides the console version of the dashboard, there’s also a web version, available in our case at http://localhost.
I won’t attach a screenshot,
but I’ll show schematically what it looks like:
Let me go into a bit more detail about what’s part of our local environment.
Databases
We use Postgres in our work.
We never talk to Postgres directly, even locally – everything goes through PgBouncer.
And the bouncer’s own config differs from production only in the logging level – nothing else.
We also use dxctl to run migrations.
We’ve unified the migrator under the hood,
and in general we use the very same tools in every one of our services.
I’ll try to go into more detail about this in a future note about implementing the Service Template microservice architecture pattern.
Back to migrations:
dxctl postgres migrate– applies migrations to the local environment;dxctl postgres status– prints information about all migrations.
Message brokers
In my previous article I talked about our approaches to asynchronous communication between services over an event bus.
Time to describe how this looks from the developer’s side.
It all starts with a .proto file, which describes the message and the name of the topic the message will be sent to and read from.
And the code-generation mechanism behind it is hidden under dxctl:
dxctl generate eventbus– this command generates producers and consumers for every message described in the.protofiles.
The generate subcommand’s capabilities don’t end there:
dxctl generate mock– triggers code generation for mocks;dxctl generate httprpc– triggers code generation forHTTPhandlers. We can’t always exposegRPC, so we fall back on strictly specifiedHTTPendpoints;dxctl generate workqueue– generates the service’s local task queue.
I wrote up a rough sketch about the task queue on my blog:
https://principal-engineering.ru/posts/postgres-workqueue/
Monitoring
Grafana, Prometheus, and Jaeger are part of our local environment.
We debug all the service dashboards of the #CloudMTS cloud platform locally, before they go out to production Grafana. The latter is closed off from direct editing in production. Updates only happen through CI.
We use grafonnet to describe Grafana dashboards.
It has both upsides and downsides,
but right now we’re only talking about the approach.
Instead of asking developers to install the right versions of jsonnet-bundler and grizzly on their own machines,
we packaged everything into Docker images,
which are also built on CI and published to an internal registry.
Working with dashboards is also automated through dxctl:
dxctl grafana apply– lets you roll a dashboard description ingrafonnetformat out onto your own local copy of Grafana. Grafana itself already has several data sources wired in, including the Prometheus deployed locally, and the Prometheus from the closed development network segment.dxctl grafana initcreates the scaffolding needed for a clean dashboard, if you need to build one from scratch.dxctl grafana export– exports the dashboard into a format Grafana understands, without applying it to the local environment.
Testing and linters
I mentioned the Service Template pattern above, so I can’t help mentioning that running tests and linters works the same way across all our services:
dxctl service test– runs all the tests;dxctl service lint– runs the linter.
The linter has a shared set of rules that are mandatory for every service. You can’t relax them for any particular service, but you can tighten them further. That’s how we keep code style consistent across our services.
That’s it for dxctl for now.
We haven’t yet covered automating the deployment process from the command line.
But we’ll leave that for next time.
I’ll try to show how you can use the GitLab API (or any other system that supports CI) for this kind of automation.
What have we got so far?
- Fast, reproducible onboarding for new hires
- A unified local environment for every developer
- A single toolset and a shared approach to microservice development
- Identical tools for every developer (matching down to the patch version), with all their complexity hidden behind a single interface
What can this run on?
Why doesn’t this article talk about the virtualization underneath? It’s simple. You can use whichever virtualization or tools currently suit you best:
- vagrant + vbox
- qemu
- docker + docker compose
- minikube
- in the cloud
What does it take to adapt a similar approach at your own company?
You can start with your own team.
- Start by mapping out your core processes: how code generation happens, what you use to describe your API, which DB schema migration tool you use and how, what third-party tools you rely on. What tasks you solve, what keeps repeating, and what part of that you can automate, hiding the complexity of a long and always-the-same list of arguments behind the scenes.
- Identify the tools used in day-to-day work: the database, the message broker,
protoc, an OpenAPI generator. - Create a separate repository or group for the current versions of your tools. That’s how you achieve version unification and make distributing each tool simple. I wrote about this here. What matters isn’t using the latest versions, but using the same version for every member of the team.
- Check with your operations team what’s used in production and in which versions. Ask them how best to build a scaled-down local copy. You don’t need to spin up as many instances of, say, Kafka – one is enough. What matters most is that your communication protocols match. And by protocols I mean not just the TCP packet format, but also the actual practices of how the tool gets used.
- And finally, get your team on board with the new tool and approach. This is probably the hardest task, but I’m sure you’ll manage. When colleagues see that a tool has a simple, understandable interface, solves their problems, and takes most of the routine work off their hands, they happily start using the new tool. And the most engaged ones become contributors of ideas and new features.
Thanks for reading!
In the comments, I invite you to share your own approaches and perspectives on this problem. I very much hope for a constructive and interesting discussion.